9 Secrets to Reducing your Fleet Expenses
As a fleet owner, your day-to-day costs can quickly add up. What you don’t know is there are further hidden, expensive...
Read more 4 mins to read


While we’re always happy to highlight the headline benefits of fleet management technology, we know there’s no substitute for real-world success stories. So, what better way to cover the advantages of our Reveal solution than by exploring how our customers use it?
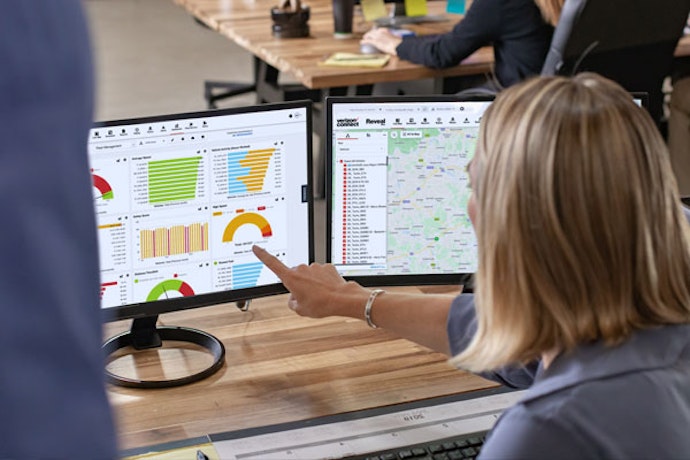
Reports are one of the most popular features of Reveal, allowing users to turn fleet data into actionable insight, spot trends and drive efficiency.
These reports can be easily scheduled and shared with team members, flagged as frequently used for quick access and exported as CSV or PDFs. So, you can make sure that everyone in your organisation has the information they need when they need it.
Below are the top six reports accessed by Verizon Connect Reveal customers.
As the name suggests, this report displays your fleet’s daily movement. It contains information on driver activity, such as start times, distances travelled, stop locations, arrival times, idle duration and departure times.
You can view driver activity throughout the day or in specific geofenced areas. Geofences are virtual perimeters around real-world locations. You can use them to mark both authorised and unauthorised routes and locations.
Any events that exceed your pre-set parameters, such as excessive stops, late starts or early finishes, are highlighted, helping you spot inefficiency fast.
The Detailed Report lays out a complete travel history for all vehicles, drivers and assets in your fleet. It can also include start and stop addresses, times spent at any stop, travel times, idling times and distances travelled.
This report is beneficial for identifying inefficient dispatching or pinpointing any vehicle, driver or asset activity to investigate anomalies or inconsistencies with performance.
Once again, you can view data across the board or in specific geofenced areas only and easily view any events that surpass your parameters. You can also filter the report to show specific status events, such as when a vehicle transitions from idling to moving or vice versa.
Quite simply, this report shows the distance travelled by your vehicles during work hours over a set timeframe chosen by you. This data can be grouped by several metrics, including vehicle and driver. You can also include other data such as odometer values, private travel, or toll travel information.
You can view distance travelled alongside driver assignments and show vehicles that have not travelled any distance. So, you get peace of mind that your vehicles and staff are working as they should be.
Our customers use this report to view instances where drivers have exceeded specified speed limits. You can view all events over a chosen speed or events within a specified amount over the set speed limit. This allows business owners and fleet managers to monitor driver behaviour and improve safety.
You can also customise this report further to show events over different speed limits. Choose from ‘Posted Speed Only’, that’s the official speed limit on the road, ‘Road Speed Only’, that’s the average speed driven on the road, or ‘Both’.
Once again, you can view this information across all locations or only in specific geofenced or saved locations.
The geofence report identifies time spent in any geofenced locations in Reveal. It allows fleet managers and business owners to monitor the frequency and duration of all visits, which can help with billing, estimates and combatting unauthorised use.
You can view events in all geofenced locations or filter by one or several. You can also filter by vehicle. The report can be customised further to include information on idling, ignition stops and more.
This report is particularly useful for promoting fleet safety. It shows an overview of all instances of harsh driving, including hard braking, quick starts, and sharp cornering by drivers over a selected period.
The information gathered is used to create a driver safety score – the better the score, the safer the driver. Any events that negatively impact a driver’s safety score by at least 30% are highlighted in red.
You can filter the report by all events, single events or any combination of hard braking, quick starts and harsh cornering. Alternatively, you can view only moderate and severe events or severe events only.
The more you know about your fleet, the faster you can spot inefficiency, focus on safety and make informed decisions. And with Reveal Reports, you can get the information you need as soon as you need it.
Visit our Fleet Tracking page to find out more about the solution. Or, if you’re ready to see it in action, book a free demo today.

Tags: All


Find out how our platform gives you the visibility you need to get more done.
As a fleet owner, your day-to-day costs can quickly add up. What you don’t know is there are further hidden, expensive...
Read moreVerizon Connect Reveal tracks the fleet data that can have a big impact on your business. These are things like where...
Read moreAt Verizon Connect, we can only provide the highest possible level of service to fleet managers and business owners by...
Read moreReveal tracks the fleet data that can have a big impact on your business. These are things like where your vehicles are...
Read more
 Call us now
0808 164 0286
Call us now
0808 164 0286